
Lesson 9 · Intermediate · 15 min
Multimodal Vision: Analyzing Charts and Images in ChatGPT
Leverage ChatGPT vision capabilities: interpreting charts, technical diagrams, whiteboard notes, and photos. OCR and visual workplace audits.
- Goal
- You will submit images, charts, and visual tables to ChatGPT to extract reliable data and interpret technical diagrams.
- Skills
- Check

Your first attempt, unaided
Take a photo of a whiteboard diagram and instruct ChatGPT to convert it into a cleanly formatted Markdown table.
ChatGPT multimodal vision processes text and imagery concurrently within a unified model. It excels at transcribing whiteboard scribbles, explaining complex workflow architecture, and extracting structured data points from business charts. To avoid misinterpretations, guide the AI to inspect axes, legends, and units before transcribing numerical values.
1Visual patch encoding and native multimodal understanding
Visual patch encoding and native multimodal understanding enable ChatGPT to reason directly across pixel representations. Rather than relying on external image-to-text plugins, GPT-4o processes visual patches natively inside transformer layers.
This integration allows the model to connect captions, callouts, and geometric geometries. However, because language models lack hardware measurement calipers, they approximate graphical proportions. When a bar chart lacks printed data labels, extracted values remain educated visual estimates.
Visual Medium Recommended Workplace Application Reliability Rating Operational Caution Labeled data charts Quantitative dashboard re-creation Very high Check axis scale zero-anchors Unlabeled trend charts High-level trajectory detection Moderate Never assume exact penny precision Handwritten whiteboards Post-meeting action item capture High Double-check custom technical jargon System architecture Technical workflow documentation Very high Validate directional arrow meanings 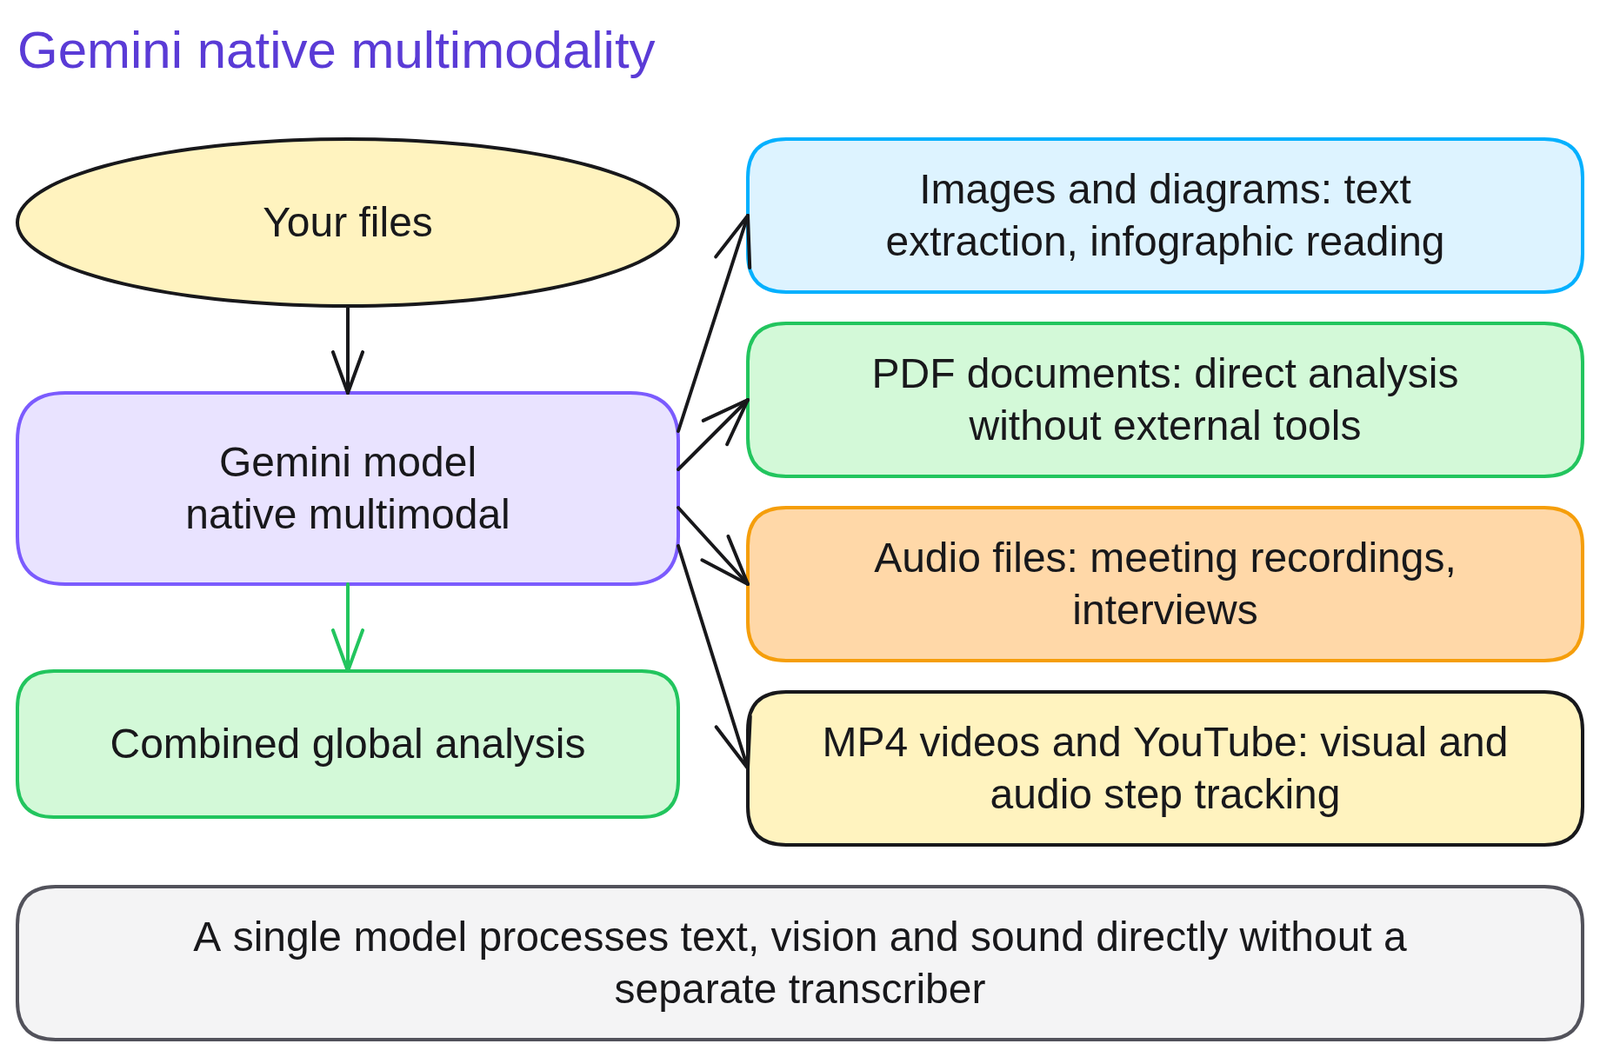
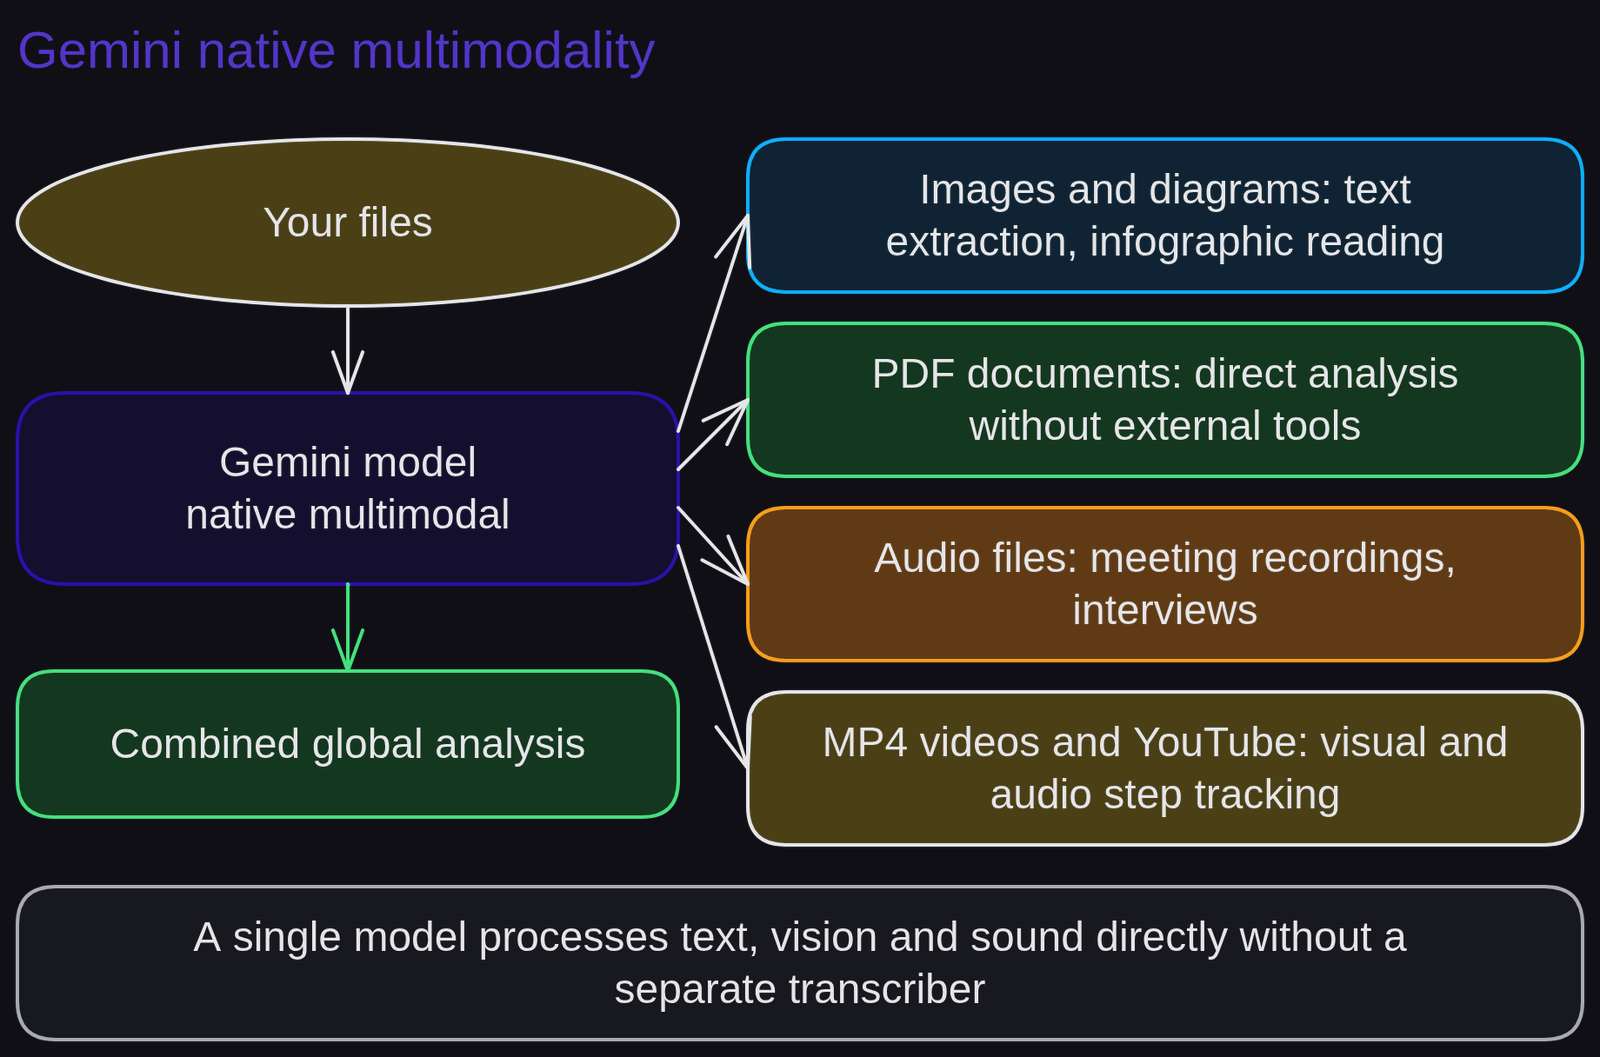
Diagram of multimodal visionDiagram generated by AI and reviewed 2Converting a complex financial chart into structured table data
Converting a complex financial chart into structured table data allows financial analysts to inject competitive intelligence into financial models without manual re-keying.
A financial controller holds a screenshot of a column chart tracking quarterly operating margins across three competitors.
Weak prompt.
Check this image and give me the numbers.The system returns an unstructured paragraph of percentages without mapping them to fiscal quarters.
Strong prompt.
Role: Financial analyst. Task: Extract data points from the attached chart into a 4-column Markdown table: Quarter, Competitor A Margin, Competitor B Margin, Competitor C Margin.
Protocol:
1. First transcribe the X-axis quarterly labels and the Y-axis percentage scale.
2. If a column lacks an explicit printed figure, prefix your visual estimate with a tilde (~).
3. Conclude with a single sentence summarizing the Q4 divergence.
What changes. The protocol anchors coordinate systems and clearly differentiates verified data labels from visual estimates.
3Transcribe handwritten whiteboard notes into digital tasks
Transcribe handwritten whiteboard notes into digital tasks to accelerate the production of post-meeting action plans.
Capture a photo of a handwritten project board or notebook page.
Upload the photograph into ChatGPT and execute this prompt:
"Role: Project coordinator. Task: Transcribe this whiteboard photo into two distinct deliverables: 1. A numbered list of approved strategic decisions; 2. A Markdown action matrix (Task, Assignee, Deadline). If any handwritten word is ambiguous, wrap it in brackets with a question mark [word?]."
Self-evaluation rubric: (a) handwriting parses accurately; (b) the task matrix is populated cleanly; (c) ambiguous words are flagged rather than guessed.
4Assuming the AI measures exact pixels or deciphers blurry crops
Assuming the AI measures exact pixels or deciphers blurry crops causes catastrophic errors when evaluating sensitive technical diagrams.
An engineer requests exact machining tolerances from a low-resolution blueprint scan where dimension lines blur together. The model hallucinates plausible dimensions to satisfy the user.
Correction: submit uncompressed, high-contrast crops and instruct the model to output 'Unreadable' whenever visual clarity is impaired.
Rule to remember: ChatGPT interprets visual semantics; it is not a calibrated industrial measurement gauge.
5Quiz
Three questions, instant feedback. Each option comes with an explanation.
6Proof of mastery
Submit a business chart or technical diagram and produce an extraction table confirming axis scales and primary values.

Criteria
What you wrote at the start of the lesson


Going further
Review glossary definitions for multimodal vision and optical character recognition. Advance to lesson 10: Advanced Data Analysis with Python. To work on dual-pane editing surfaces, explore ChatGPT Canvas: collaborative workspace.
Frequently asked questions
Which image formats can ChatGPT analyze?
ChatGPT ingests PNG, JPEG, WEBP, and non-animated GIF files showing screenshots, charts, technical diagrams, and paperwork.
Can ChatGPT identify individuals in photographs?
No, OpenAI applies strict safety guardrails blocking facial recognition and identity attribution for private persons.
How can you boost extraction accuracy on complex charts?
Submit high-resolution crops, avoid compression artifacts, and prompt the model to transcribe axis labels before reading data points.