
Lesson 10 · Intermediate · 15 min
Advanced Data Analysis: Exact Computations with Python
Master Advanced Data Analysis in ChatGPT: executing Python in a secure sandbox, data hygiene, exact computations, and exportable charts.
- Goal
- You will leverage the ChatGPT Python sandbox to perform deterministic mathematical calculations, clean raw datasets, and generate charts.
- Skills
- Check

Your first attempt, unaided
Upload a CSV file and instruct ChatGPT to compute the mean and median of a column while showing the executed Python code.
Advanced Data Analysis equips ChatGPT with an autonomous Python runtime executing within a secure sandbox. This capability transforms numerical work: rather than predicting statistics probabilistically, the model writes and executes deterministic scripts with pandas, numpy, and matplotlib. Users gain mathematical precision alongside exportable datasets and publication-ready charts.
1The sandboxed Python environment and deterministic math
The sandboxed Python environment and deterministic math eliminate the historical vulnerability of language models when handling quantitative arithmetic. Neural networks excel at conceptual relationships but approximate complex numerical math.
With an integrated Python engine, ChatGPT avoids mental math: it writes computer code, executes the program inside an isolated sandbox container, and parses console outputs. This paradigm ensures that balance totals, standard deviations, and percentages are mathematically exact.
Component Role in Workflow Standard Library Deliverable Produced Ingestion Parses tabular files pandas Automatic column and dtype detection Hygiene & Scrubbing Handles missing entries and deduplication pandas, re Cleaned dataset ready for download Statistical Computing Evaluates means, medians, correlations numpy, scipy 100% deterministic mathematical accuracy Data Visualization Plots publication-quality charts matplotlib, seaborn High-resolution PNG image download links 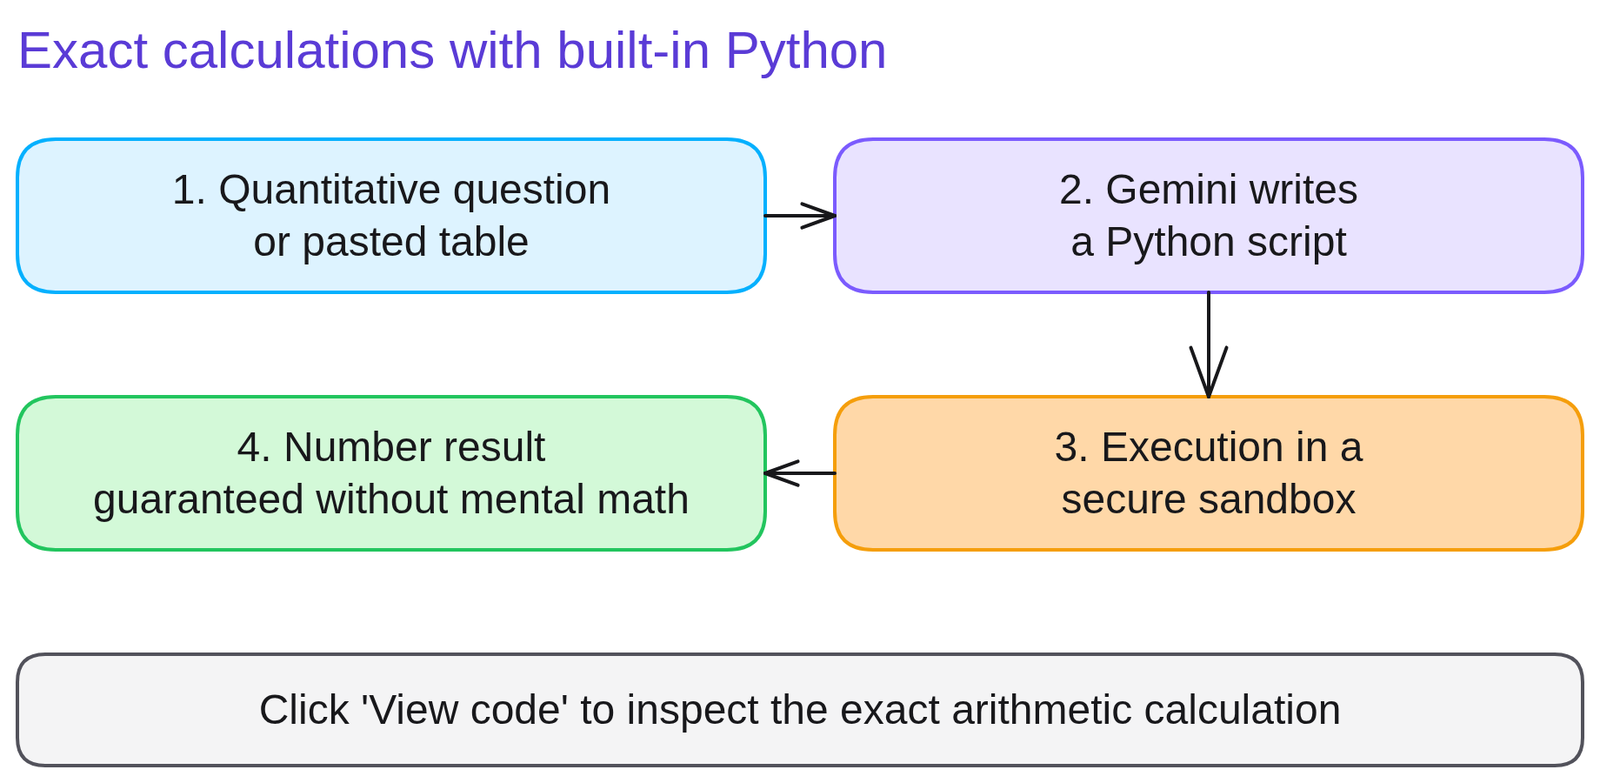
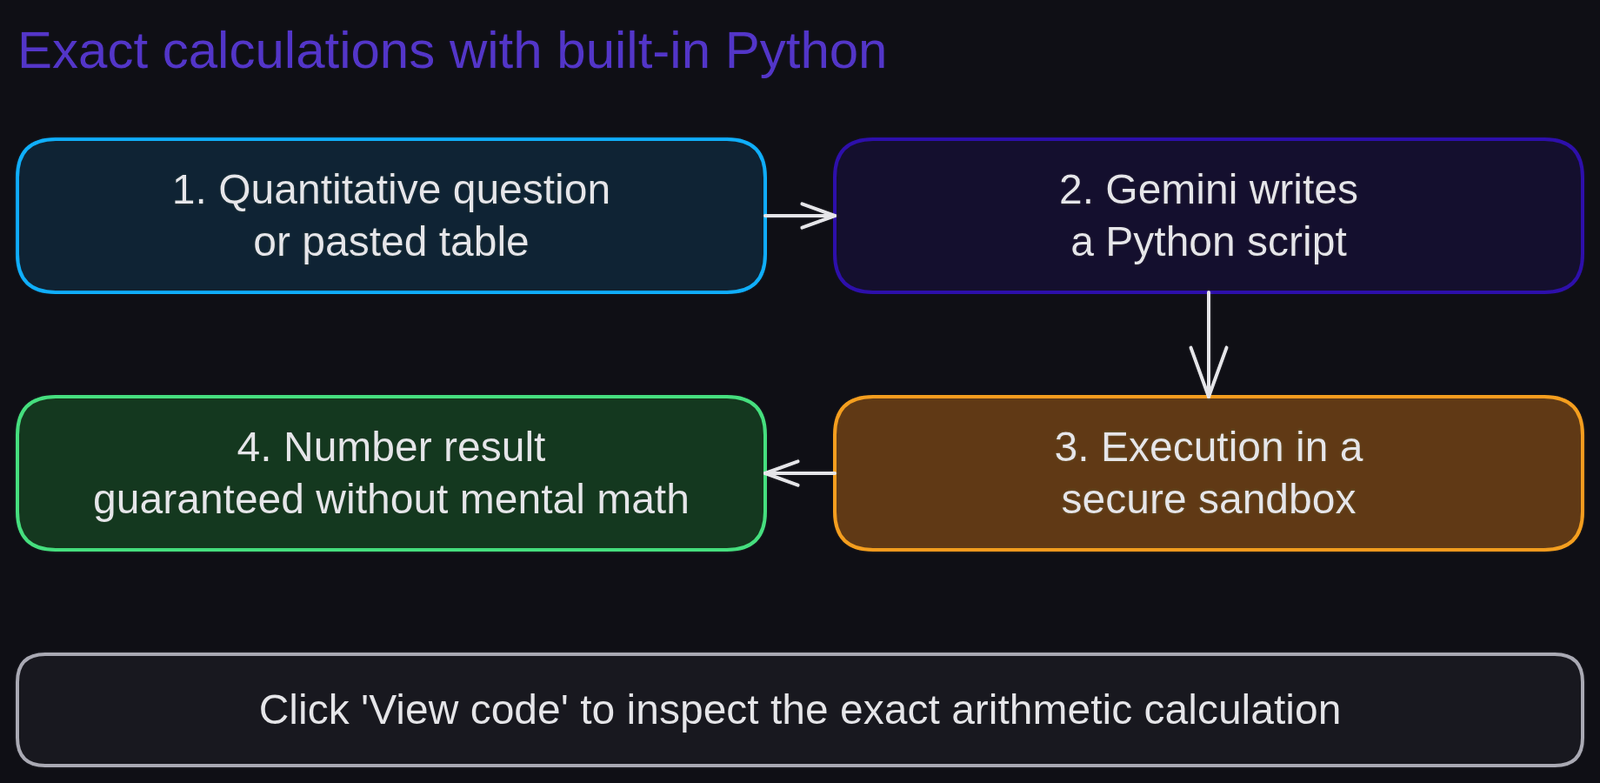
Diagram of Python data analysisDiagram generated by AI and reviewed 2Cleaning customer address files and computing sales metrics
Cleaning customer address files and computing sales metrics showcases how semantic error detection pairs with deterministic calculations.
An e-commerce manager holds an export of 5,000 transactions featuring irregular ZIP codes and mixed currency notations.
Weak prompt.
Here is our sales export. Calculate the average order value and flag ZIP code errors.The system may inspect only the first few rows without executing comprehensive script-level iterations.
Strong prompt.
Role: Data engineer. Task: Process the attached CSV file with Python.
Protocol:
1. Detect and standardize 5-digit postal codes (prepend leading zeros if missing).
2. Filter out rows containing negative or zero order totals.
3. Compute the mean, median, and standard deviation of net order values post-cleaning.
4. Display the complete executed Python code and provide a direct download link for the sanitized CSV.
What changes. The strong prompt dictates a pipeline sequence and mandates transparent source code, enabling data teams to reproduce the logic locally.
3Generate a downloadable statistical chart in PNG format
Generate a downloadable statistical chart in PNG format to practice producing executive-level charts in seconds.
Upload a table containing monthly business data (such as sales volume or support ticket volumes).
Execute this charting directive:
"Role: Business Intelligence specialist. Task: Write a Python script to plot monthly performance as a clean line chart using matplotlib. Display the annual mean as a dashed red baseline. Apply a clean white theme, French axis labels, and generate a high-resolution PNG download link."
Self-evaluation rubric: (a) the Python block runs without runtime faults; (b) the baseline average reflects computed metrics; (c) the direct image download link is provided.
4Failing to inspect the underlying Python code behind surprising numbers
Failing to inspect the underlying Python code behind surprising numbers leads analysts to validate dashboards based on erroneous column selection.
If a dataset includes both 'Gross Revenue' and 'Net Recognized Revenue', the model might query the wrong series in its pandas filter without declaring the ambiguity.
Correction: click the 'Analysis' expander to review the script's column selections and filtering logic.
Rule to remember: the Python interpreter never errs in arithmetic, but the language model can select the wrong column when generating the script.
5Quiz
Three questions, instant feedback. Each option comes with an explanation.
6Proof of mastery
Upload a numerical dataset, request statistical processing via Python, and audit the script to verify computational logic.

Criteria
What you wrote at the start of the lesson


Going further
Review definitions for python interpreter and sandbox environment. Advance to lesson 11: ChatGPT Canvas: collaborative workspace. For protocols dedicated to factual verification, explore Hunting ChatGPT hallucinations.
Frequently asked questions
What is Advanced Data Analysis (formerly Code Interpreter)?
It is an isolated Python sandbox environment where ChatGPT writes and executes scripts to clean data, compute figures, and render charts.
Why does Python guarantee computational accuracy?
Calculations are executed deterministically by a Python runtime, eliminating the probabilistic approximation errors of neural language models.
Can the Python sandbox connect to the public internet?
No, the Python runtime operates in an isolated, ephemeral sandbox with no external network connectivity for data protection.