
Lesson 9 · Intermediate · 15 min
Native multimodality: analyzing diagrams, screenshots, and invoices
Leverage Gemini's native vision: extract numbers from invoices, interpret system architecture diagrams, and audit technical infographics.
- Goal
- You will harness Gemini's visual processing to interpret architecture diagrams, transcribe whiteboard notes, and audit scanned invoices.
- Skills
- Check

Your first attempt, unaided
Take a photo of whiteboard notes or an architectural schematic screenshot and instruct Gemini to extract an action roadmap from it.
Gemini analyzes images natively without relying on a disconnected OCR tool: image pixels and text tokens are processed in the same neural space. You can submit network topology diagrams, scanned forms, and user interfaces. For best results, crop the area of interest and require a factual inventory before requesting analysis.
1Vision without middle layers: pixels parsed like tokens
Vision without middle layers processes raw pixels directly as core semantic tokens. Gemini unifies image perception and logical reasoning, allowing it to correlate visual shapes and technical annotations instantaneously.
Unlike legacy software architectures that pipe a rigid OCR engine into a separate language model, Gemini was pretrained natively on interwoven multimodal data. It understands spatial layouts, handwriting, architectural blueprints, and complex industrial schematics. This native multimodality accelerates the review of invoices, engineering diagrams, and software interface screenshots.
Visual asset What Gemini detects Workplace risk Recommended prompting instruction Architecture diagram Gateways, firewalls, servers, connectors Misinterpreting overlapping connection paths « List every node and its explicit links first » Scanned form Cursive handwriting and checkboxes Misreading handwritten numerical digits « Transcribe the field before interpreting » UI screenshot Buttons, input forms, layout hierarchies Overlooking collapsed dropdown elements « Detail every interactive element on screen » 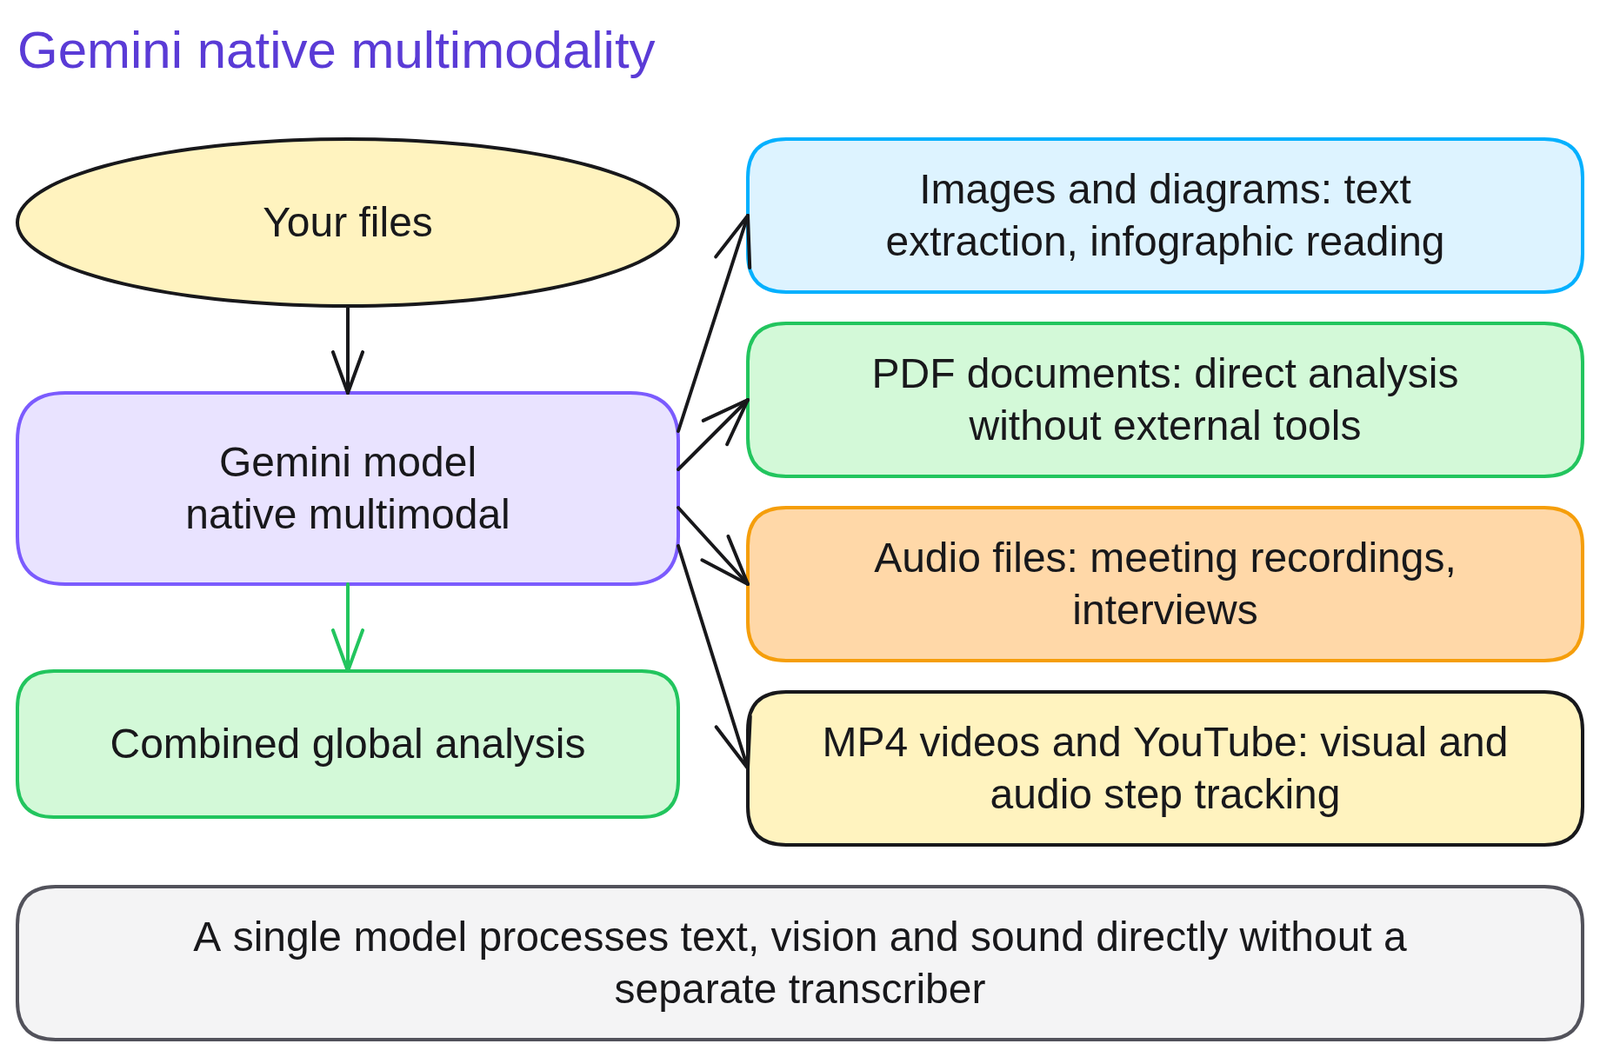
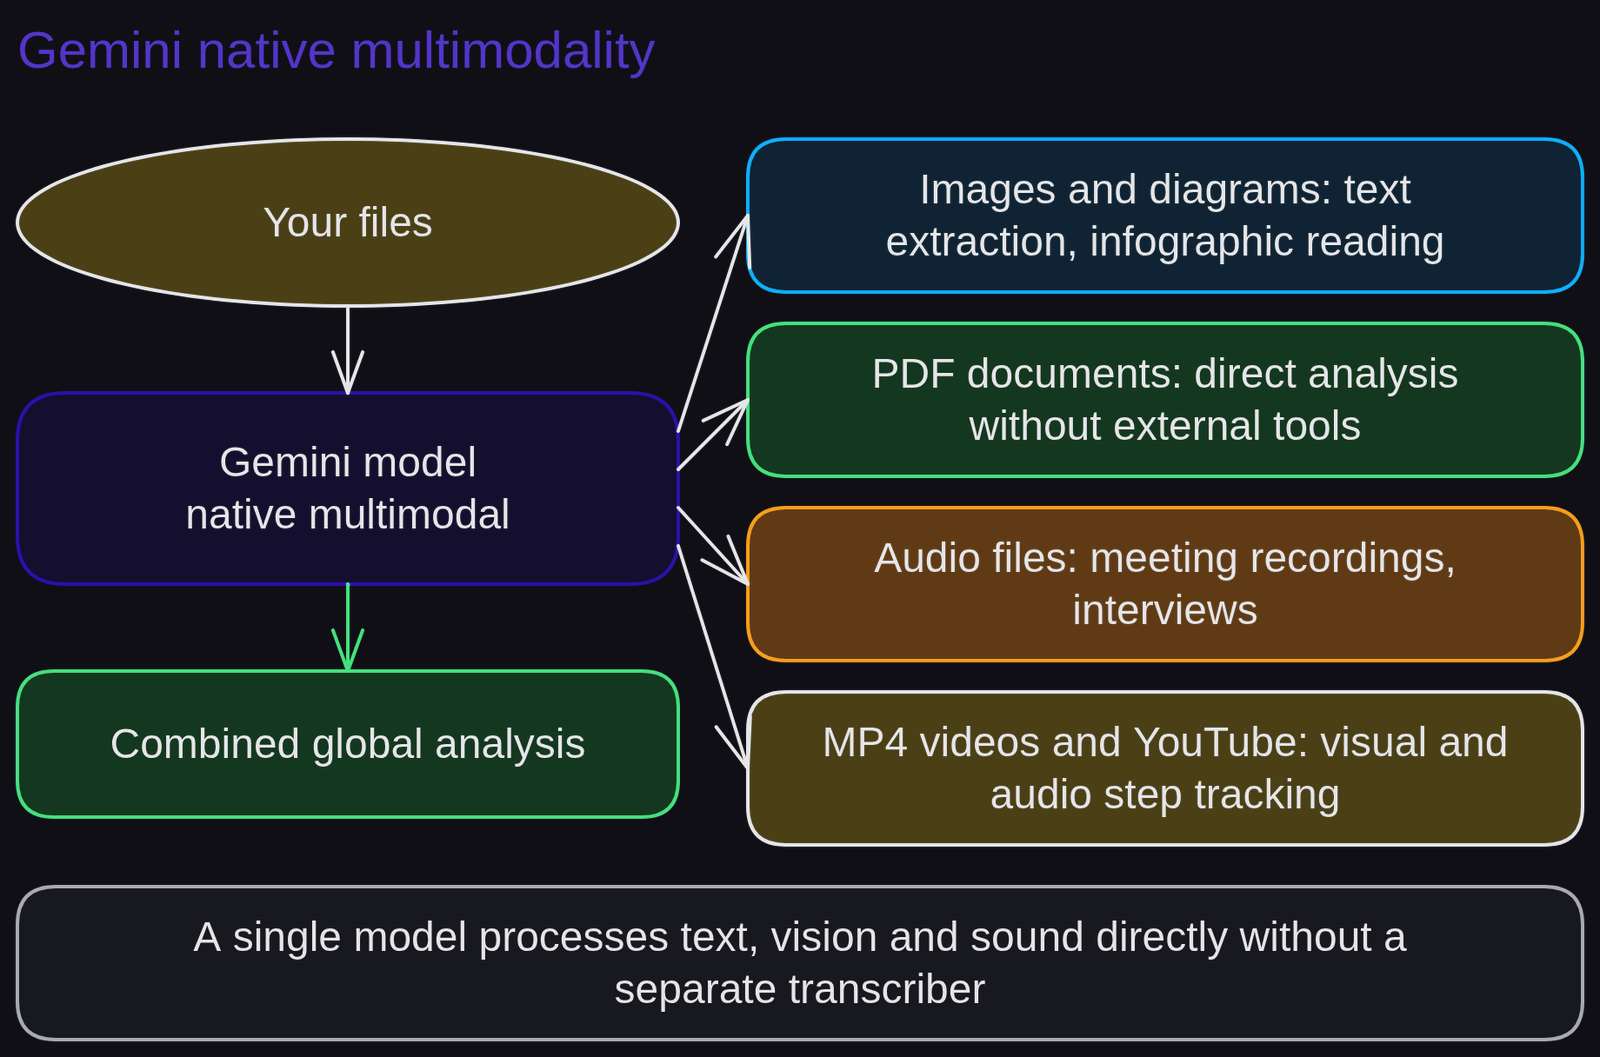
Diagram 'Gemini native multimodality'Diagram generated by AI and reviewed 2Auditing a network architecture diagram to identify single points of failure
Auditing a network architecture diagram to identify single points of failure illustrates how Gemini native vision pinpoints systemic redundancy gaps without requiring manual component inventories.
An infrastructure architect needs to verify disaster recovery resilience on a proposed cloud migration blueprint.
Weak prompt.
Check this network diagram and tell me if it looks good.Gemini returns a generic confirmation noting that the diagram depicts modern cloud practices, failing to catch an unhedged single gateway.
Strong prompt.
Analyze the attached infrastructure diagram. Inventory each load balancer, cluster, and link. Identify whether any single component could cause total service disruption upon failure. If so, identify the component and outline a redundant failover link in 80 words.The difference. Forcing an exhaustive component inventory before risk analysis compels the model to trace actual connection paths, isolating a non-redundant database proxy.
3Convert an interface screenshot into user story specifications
Convert an interface screenshot into user story specifications to test Gemini capability to transform visual mockups into structured technical documentation for engineering teams.
Capture a screenshot of a software input form or portal screen. Upload the image to Gemini and instruct it to extract every visible input field, button, and validation rule.
Run this prompt:
'Based on the attached UI screenshot, draft a functional specification table with columns: Element Name, Control Type, Expected Format, and Business Validation Rule. Limit to 120 words.'
Self-evaluation rubric: (a) all visible fields in the screenshot are cataloged ; (b) control types are classified accurately ; (c) the generated specification table is immediately usable by developers.
4Uploading heavily compressed images where small metrics blur
Uploading heavily compressed images where small metrics blur generates dangerous hallucinations because generative models compensate for illegible pixels with statistically likely values.
When uploading heavily compressed JPEG images, small annotations and decimal points degrade into ambiguous noise. Rather than alerting you, Gemini often guesses plausible numbers to provide a complete answer.
Fix: crop high-resolution screenshots directly around relevant tables or use lossless PNG formats to preserve sharp character edges.
Rule to remember: if a human reviewer cannot discern an image digit with certainty, Gemini will hallucinate the metric.
5Quiz
Three questions, instant feedback. Each option comes with an explanation.
6Proof of mastery
Upload a technical diagram or interface screenshot to Gemini and share the generated structured breakdown, validating extracted elements against the image.

Criteria
What you wrote at the start of the lesson


Going further
Review glossary definitions for multimodality and visual grounding. The next lesson, Calculation and data with Python, covers computational accuracy. Explore Analyze a video to apply multimodal analysis across moving video footage.
Frequently asked questions
Does Gemini rely on third-party OCR tools to read images?
No. Unlike legacy systems that run optical character recognition before sending text to the LLM, Gemini was pre-trained natively on visual tokens alongside text.
Can you submit multiple images to compare?
Yes. You can upload two interface mockups or two architectural diagrams and prompt Gemini to itemize visual and logical discrepancies.
What resolution is recommended?
Provide clean images of at least 1,000 pixels width to guarantee that table metrics, small fonts, and axis labels remain crisp.